Machine Learning
约 3490 个字 597 行代码 8 张图片 预计阅读时间 25 分钟
抛去无意义的话,直接进入正题。
引入
假设我需要向银行借钱,银行根据我的年龄(\(x_1\)),工资(\(x_2\)),来决定贷款的额度(h)。
这相当于在一个空间直角坐标系中,拟合出一个最合适的平面。
记拟合的平面为\(h_{\theta}(x) = \theta_0 +\theta_1 x_2+\theta_2 x_2\)
记\(\mathbf{x} = \begin{bmatrix} 1 \\ x_1 \\ x_2 \end{bmatrix}\),\(\mathbf{\theta} = \begin{bmatrix} \theta_0 \\ \theta_1 \\ \theta_2 \end{bmatrix}\),则\(h_{\theta}(x)=\theta^T x\)
此外,我们还需要定义一个误差项\(\epsilon\),因此现在对于每一个我们已知的样本点,如果用y来表示实际值,\(y^{(i)}=\theta^T x^{(i)} + \epsilon^{(i)}\)
对于误差\(\epsilon^{(i)}\), 有如下性质:
-
独立:张三和李四都来贷款,他们俩能借到多少钱相互之间无关 -- 数据之间独立
-
同分布:他俩都得去同一家银行 -- 数据服从相同的概率分布,即每个误差项\(\epsilon^{(i)}\)都来自相同的分布。
-
标准正态分布:误差服从均值为0且方差为\(\sigma^2\)的正态分布,可以表示为: $ x \sim \mathcal{N}(0, \theta^2) $
似然函数
对于上面的案例,由于误差服从正态分布,其密度函数为\(f(\epsilon^{(i)})=\frac{1}{\sqrt{2 \pi \sigma^2}} \exp\left(- \frac{(\epsilon^{(i)})^2}{2 \sigma^2}\right)\)
我们用\(y, x\)来表示\(\epsilon\),于是得到\(f(y^{(i)}|x^{(i)}, \theta)= \frac{1}{\sqrt{2 \pi \sigma^2}} \exp\left(- \frac{(y^{(i)} - \theta^T x^{(i)})^2}{2 \sigma^2}\right)\)
似然函数定义
似然函数表示为所有观测值的联合概率密度函数
对数似然函数
有时为了简化计算,我们会取一个对数。
进一步简化对数似然函数:
现在再回过头来思考一下,我们的目的是什么呢?就是让似然函数越大越好。考虑上式中的变量,我们只需要让\(\frac{1}{2}\sum_{i=1}^n((y^{(i)} - \theta^T x^{(i)})^2)\)越小越好.
不妨记\(J(\theta) = \frac{1}{2}\sum_{i=1}^n((y^{(i)} - \theta^T x^{(i)})^2)\)
对\(\theta\) 求偏导:
要求极值点,因此偏导为0
梯度下降
上面的似然函数推导听上去很美好,X,Y都是已知的,我们只需要 代进去就能得出\(\theta\),然而,\(X^T X\)并不总是可逆的,这就意味着 我们不能直接得出\(\theta\)的值。因此,需要引入梯度下降的概念。
概念
机器学习的主要目的是通过迭代地调整模型参数,以最小化损失函数。因为有许多目标函数是不可解的,因此,需要梯度下降的思想。
做法
梯度在数学的学习中都已经接触过,是一个多元函数在某点处变化最快的方向和速率,是一个向量,也是我们常说的方向导数。
假设现在我们的目标函数是\(J(\theta)= \frac{1}{2m} \sum^m_{i=1}(y^i - h_{\theta}(x^i))^2\),初始先随机取\(\theta\)的值,为了不断更新\(\theta\)来让预测值和真实值更接近,有如下方法
批量梯度下降 (Batch Gradient Descent)
批量梯度下降使用整个训练集来计算梯度更新。
公式:
解释:
- \(\theta\):参数向量
- \(\alpha\):学习率
- \(m\):训练样本的数量
- \(h_{\theta}(x^i)\):模型的预测值
- \(y^i\):某个真实值
- \(x^i\):某个输入特征向量
- \(x^i_j\):某个输入向量与参数\(\theta_j\)相匹配的
随机梯度下降 (Stochastic Gradient Descent)
随机梯度下降每次只使用一个训练样本来更新参数。
公式:
解释:
- \(\theta\):参数向量
- \(\alpha\):学习率
- \(h_{\theta}(x^i)\):模型的预测值
- \(y^i\):某个真实值
- \(x^i\):某个输入特征向量
- \(x^i_j\):某个输入向量与参数\(\theta_j\)相匹配的
小批量梯度下降 (Mini-batch Gradient Descent)
小批量梯度下降使用一小部分训练样本(称为小批量)来计算梯度更新。
公式:
解释:
- \(\theta\):参数向量
- \(\alpha\):学习率
- \(b\):小批量的样本数量
- \(h_{\theta}(x^i)\):模型的预测值
- \(y^i\):某个真实值
- \(x^i\):某个输入特征向量
- \(x^i_j\):某个输入向量与参数\(\theta_j\)相匹配的
需要说明一下的是,学习率相当于是每次参数更新的步长大小,因为我们算出来的梯度只是在某一点的方向导数,并不能代表全部,所以更新的学习率需要仔细考虑。
线性回归模型实战
Normalize
Normalize就是将数据进行像正态分布一样的处理。
标准化的数学公式如下:
其中:
-
\(x\) 为原始数据,
-
\(\mu\) 为数据的均值,
-
\(\sigma\) 为数据的标准差。
标准化通过减去均值并除以标准差,将数据转换为均值为0,标准差为1的正态分布。
import numpy as np


def normalize(features):

    features_normalized = np.copy(features).astype(float)

    # 计算均值
    features_mean = np.mean(features, 0)

    # 计算标准差
    features_deviation = np.std(features, 0)

    # 标准化操作
    if features.shape[0] > 1:
        features_normalized -= features_mean

    # 防止除以0
    features_deviation[features_deviation == 0] = 1
    features_normalized /= features_deviation

    return features_normalized, features_mean, features_deviation
Sinusoids
生成正弦波特征
import numpy as np


def generate_sinusoids(dataset, sinusoid_degree):
    """
    生成正弦波特征。
    """
    # 获取数据集中的样本数量
    num_examples = dataset.shape[0]
    # 初始化一个空数组,用于存储生成的正弦特征
    sinusoids = np.empty((num_examples, 0))

    # 生成指定次数的正弦特征
    for degree in range(1, sinusoid_degree + 1):
        # 计算正弦值
        sinusoid_features = np.sin(degree * dataset)
        # 将新生成的正弦特征连接到 sinusoids 数组的列方向上
        sinusoids = np.concatenate((sinusoids, sinusoid_features), axis=1)

    # 返回生成的正弦特征数组
    return sinusoids
Polynomial
处理多项式特征。
"""Add polynomial features to the features set"""

import numpy as np
from .normalize import normalize


def generate_polynomials(dataset, polynomial_degree, normalize_data=False):
    """变换方法:
    x1, x2, x1^2, x2^2, x1*x2, x1*x2^2, etc.
    """

    # 将数据集按列分割成两个子集
    features_split = np.array_split(dataset, 2, axis=1)
    dataset_1 = features_split[0]
    dataset_2 = features_split[1]

    # 获取每个子集的样本数量和特征数量
    (num_examples_1, num_features_1) = dataset_1.shape
    (num_examples_2, num_features_2) = dataset_2.shape

    # 检查两个子集的样本数量是否相同
    if num_examples_1 != num_examples_2:
        raise ValueError('Can not generate polynomials for two sets with different number of rows')
    # 检查两个子集是否都有特征列
    if num_features_1 == 0 and num_features_2 == 0:
        raise ValueError('Can not generate polynomials for two sets with no columns')

    # 如果第一个子集没有特征列,使用第二个子集;反之亦然
    if num_features_1 == 0:
        dataset_1 = dataset_2
    elif num_features_2 == 0:
        dataset_2 = dataset_1

    #重新更新,获取最新的样本数量和特征数量
    (num_examples_1, num_features_1) = dataset_1.shape
    (num_examples_2, num_features_2) = dataset_2.shape


    # 确定要使用的特征数量,选择较小的特征数
    num_features = num_features_1 if num_features_1 < num_features_2 else num_features_2
    dataset_1 = dataset_1[:, :num_features]
    dataset_2 = dataset_2[:, :num_features]

    # 初始化一个空数组,用于存储生成的多项式特征
    polynomials = np.empty((num_examples_1, 0))

    # 生成多项式特征
    for i in range(1, polynomial_degree + 1):
        for j in range(i + 1):
            # 计算每个多项式特征
            polynomial_feature = (dataset_1 ** (i - j)) * (dataset_2 ** j)
            # 将新特征按列方向连接到 polynomials 数组中
            polynomials = np.concatenate((polynomials, polynomial_feature), axis=1)

    # 如果需要,进行标准化处理
    if normalize_data:
        polynomials = normalize(polynomials)[0]

    # 返回生成的多项式特征数组
    return polynomials
数据预处理模块
使用上面写的模块对数据进行预处理。
"""Prepares the dataset for training"""

import numpy as np
from .normalize import normalize
from .generate_sinusoids import generate_sinusoids
from .generate_polynomials import generate_polynomials


def prepare_for_training(data, polynomial_degree=0, sinusoid_degree=0, normalize_data=True):

    # 计算样本总数
    num_examples = data.shape[0]

    data_processed = np.copy(data)

    # 预处理
    features_mean = 0
    features_deviation = 0
    data_normalized = data_processed
    if normalize_data:
        (
            data_normalized,
            features_mean,
            features_deviation
        ) = normalize(data_processed)

        data_processed = data_normalized

    # 特征变换sinusoidal
    if sinusoid_degree > 0:
        sinusoids = generate_sinusoids(data_normalized, sinusoid_degree)
        data_processed = np.concatenate((data_processed, sinusoids), axis=1)

    # 特征变换polynomial
    if polynomial_degree > 0:
        polynomials = generate_polynomials(data_normalized, polynomial_degree, normalize_data)
        data_processed = np.concatenate((data_processed, polynomials), axis=1)

    # 加一列1,为了计算常数项($$\theta_0$$)
    data_processed = np.hstack((np.ones((num_examples, 1)), data_processed))

    return data_processed, features_mean, features_deviation
类:LinearRegression 用于线性模型的机器学习
init初始化
import numpy as np

from linearstudy.utils.features import prepare_for_training

class LinearRegression:
    def __init__(self, data, labels, polynomial_degree=0, sinusoid_degree=0, normalize_data=True):
        # 准备训练数据,包括多项式特征、正弦特征和数据归一化
        (data_processed, features_mean, features_deviation) = prepare_for_training(data, polynomial_degree, sinusoid_degree, normalize_data)

        self.data = data_processed  # 处理后的数据
        self.labels = labels  # 标签,即真实值
        self.features_mean = features_mean  # 特征均值
        self.features_deviation = features_deviation  # 特征标准差
        self.polynomial_degree = polynomial_degree  # 多项式特征的度数
        self.sinusoid_degree = sinusoid_degree  # 正弦特征的度数
        self.normalize_data = normalize_data  # 是否归一化数据

        number = self.data.shape[1]  # 特征数量

        self.theta = np.zeros((number, 1))  # 初始化参数为零向量
预测函数(Hypothesis)
hypothesis函数主要是根据实际的x值与参数\(\theta\)y值
# 计算预测值
    def hypothesis(data, theta):
        predictions = np.dot(data, theta)  # 线性回归的预测值
        return predictions
使用全部样本数据更新\(\theta\)(Compute_gradient)
数学公式如下(正如我们在这里提到的):
其中:
-
\(\theta\) 为参数向量,
-
\(\alpha\) 为学习率,
-
\(m\) 为样本数量,
-
\(X\) 为数据矩阵,
-
\(y\) 为标签向量。
在代码中,compute_gradient 函数通过以下步骤实现梯度下降:
-
计算预测值:
使用当前参数 \(\theta\) 计算预测值。 -
计算预测误差:
预测值与实际标签之间的差异。 -
更新参数:
根据梯度下降公式更新参数 \(\theta\)。
# 梯度下降的计算,使用矩阵一次性使用所有样本的数据
def compute_gradient(self, alpha):
    num_examples = self.data.shape[0]  # 样本数量
    predictions = LinearRegression.hypothesis(self.data, self.theta)  # 预测值
    delta = predictions - self.labels  # 预测误差
    theta = self.theta
    theta = theta - alpha * (1.0 / num_examples) * np.dot(delta.T, self.data).T  # 更新参数
     self.theta = theta
损失函数的计算(Compute_cost)
通过计算损失函数并绘图可以帮助我们可视化训练的过程
def compute_cost(self, data, labels):
    num_examples = data.shape[0]  # 样本数量
    predictions = LinearRegression.hypothesis(data, self.theta)  # 预测值
    cost = (1.0 / (2 * num_examples)) * np.sum(np.square(predictions - labels))  # 均方误差
    return cost
使用梯度下降法并记录损失值(Gradient_descent)
def gradient_descent(self, alpha, iterations):
    # 梯度下降法
    loss = []
    for _ in range(iterations):
        self.compute_gradient(alpha)  # 计算梯度并更新参数
        loss.append(self.compute_cost(self.data, self.labels))  # 记录损失值
    return loss
Train
 def train(self, alpha, iterations=500):
    # 训练模型,使用梯度下降法
    cost_history = self.gradient_descent(alpha, iterations)
    return cost_history, self.theta
Get_cost
def get_cost(self, data, labels):
    # 获取给定数据的损失值
    data_processed, _, _ = prepare_for_training(data, self.polynomial_degree, self.sinusoid_degree, self.normalize_data)
    return self.compute_cost(data_processed, labels)
Predict
def predict(self, data):
    # 预测给定数据的结果
    data_processed, _, _ = prepare_for_training(data, self.polynomial_degree, self.sinusoid_degree, self.normalize_data)
    return LinearRegression.hypothesis(data_processed, self.theta)
使用实际数据集实战
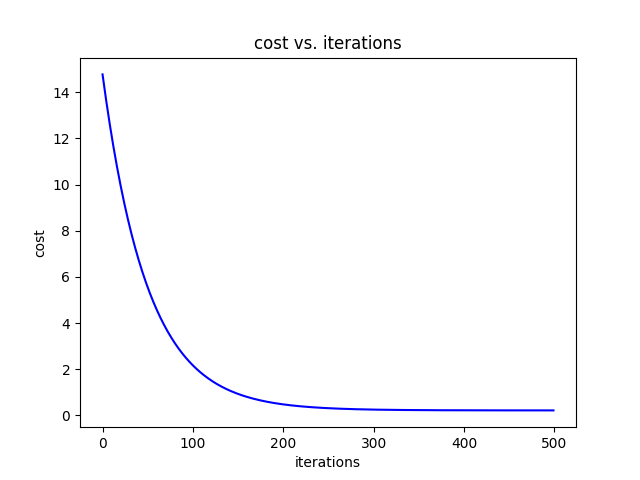
实战一:只对一个自变量进行预测(Economy..GDP.per.Capita.)
import numpy as np
import pandas as pd
import matplotlib.pyplot as plt

from linear import LinearRegression

data =pd.read_csv('linearstudy/data/world-happiness-report-2017.csv')

train_data =  data.sample(frac=0.8, random_state=200)
# 得到测试数据,drop方法是删除指定行的数据,这里是删除训练数据,得到测试数据
test_data = data.drop(train_data.index)

x_train = train_data[['Economy..GDP.per.Capita.']].values


y_train = train_data[['Happiness.Score']].values

x_test = test_data[['Economy..GDP.per.Capita.']].values

y_test = test_data[['Happiness.Score']].values

num_iterations = 500

alpha = 0.01

linear_regression = LinearRegression(x_train, y_train, polynomial_degree=1, normalize_data=True)

(cost,theta) = linear_regression.train(alpha, num_iterations)

print(f"开始时的损失值:{cost[0]}")

print(f"结束时的损失值:{cost[-1]}")

plt.plot(range(num_iterations), cost, color='blue')

plt.xlabel('iterations')

plt.ylabel('cost')

plt.title('cost vs. iterations')

plt.show()

predictions_nums = 100

x_predictions = np.linspace(x_test.min(), x_test.max(), predictions_nums).reshape(-1, 1)

y_predictions = linear_regression.predict(x_predictions)

plt.scatter(x_test, y_test, color='blue')

plt.scatter(x_train, y_train, color='red')

plt.plot(x_predictions, y_predictions, color='green')

plt.xlabel('Economy..GDP.per.Capita.')

plt.ylabel('Happiness.Score')

plt.title('Economy..GDP.per.Capita. vs. Happiness.Score')

plt.show()
实战二:对两个自变量同时进行预测
其实在我们一开始写的文件中就已经处理了多个自变量的情况。 比如在init中,
number = self.data.shape[1] # 特征数量
self.theta = np.zeros((number, 1)) # 初始化参数为零向量>
因此我们只要多取一列数据即可
import numpy as np
import pandas as pd
import matplotlib.pyplot as plt
from linear import LinearRegression
data =pd.read_csv('linearstudy/data/world-happiness-report-2017.csv')

train_data =  data.sample(frac=0.8, random_state=200)
# 得到测试数据,drop方法是删除指定行的数据,这里是删除训练数据,得到测试数据
test_data = data.drop(train_data.index)

x_train = train_data[['Economy..GDP.per.Capita.','Freedom']].values

y_train = train_data['Happiness.Score'].values

x_test = test_data[['Economy..GDP.per.Capita.','Freedom']].values

y_test = test_data['Happiness.Score'].values


num_iterations = 500

alpha = 0.01

linear_regression = LinearRegression(x_train, y_train, polynomial_degree=1, normalize_data=True)

(cost,theta) = linear_regression.train(alpha, num_iterations)

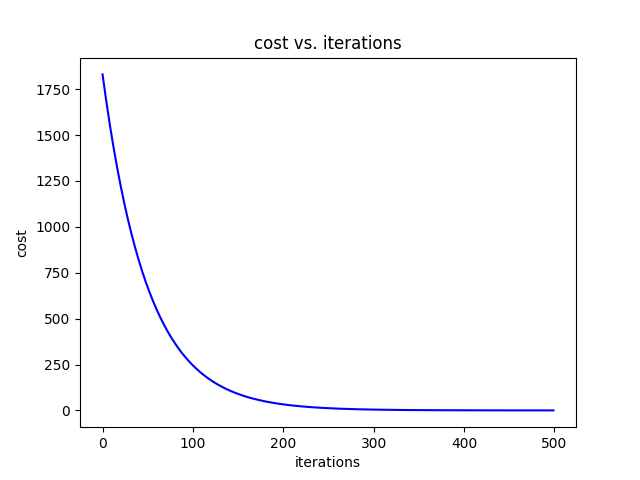
print(f"开始时的损失值:{cost[0]}")

print(f"结束时的损失值:{cost[-1]}")

plt.plot(range(num_iterations), cost, color='blue')

plt.xlabel('iterations')

plt.ylabel('cost')

plt.title('cost vs. iterations')

plt.show()
所以我们可以看到,用两个自变量是比一个自变量训练效果好的
非线性回归
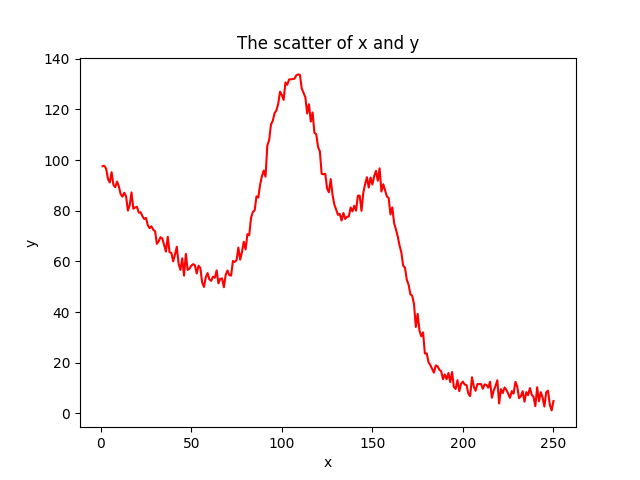
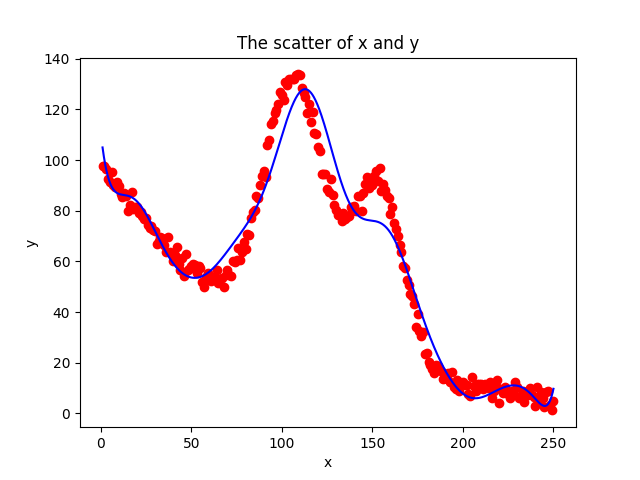
在上面的联系中,我们在训练\(\theta\)时都是默认x的次数是一次,也就是因变量与自变量的关系是线性的。下面是当我们假设因变量和自变量关系是非线性的情况。
读取数据
import numpy as np

import pandas as pd

import matplotlib.pyplot as plt

from linear import LinearRegression

data = pd.read_csv('linearstudy/data/non-linear-regression-x-y.csv')

x=data['x'].values.reshape(data.shape[0],1)

y=data['y'].values.reshape(data.shape[0],1)

plt.plot(x, y,'r')

plt.xlabel('x')

plt.ylabel('y')

plt.title('The scatter of x and y')

plt.show()
做非线性处理
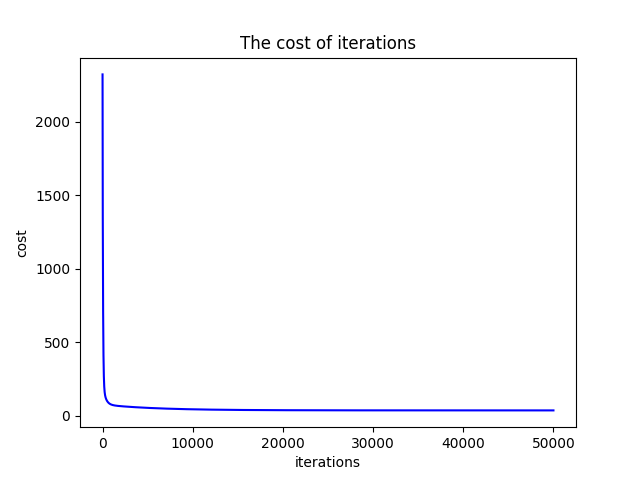
iterations = 50000

alpha = 0.01

polynomial_degree = 15

normalize_data = True

sinusoid_degree = 15

linear_regression = LinearRegression(x, y, polynomial_degree, sinusoid_degree,normalize_data )
在上述代码中:
-
多项式次数 (polynomial_degree = 15):将原始特征扩展为15次多项式,有助于捕捉数据中的高次非线性关系.
-
正弦波次数 (sinusoid_degree = 15):引入15个不同频率的正弦函数,增强模型对周期性模式的识别能力。
训练
(cost_history,theta) = linear_regression.train(alpha, iterations)

print(f'开始损失值: {cost_history[0]}')

print(f'结束损失值: {cost_history[-1]}')

plt.plot(range(iterations), cost_history, 'b')

plt.xlabel('iterations')

plt.ylabel('cost')

plt.title('The cost of iterations')

plt.show()

predicton_nums = 1000

x_pred = np.linspace(x.min(), x.max(), predicton_nums).reshape(predicton_nums, 1)

y_pred = linear_regression.predict(x_pred)

plt.scatter(x, y, c='r')

plt.plot(x_pred, y_pred, 'b')

plt.xlabel('x')

plt.ylabel('y')

plt.title('The scatter of x and y')

plt.show()
模型评估
Sklearn
Sklearn库是一个功能强大的机器学习库,提供了丰富的算法和工具用于数据预处理、特征选择、模型训练和评估。
安装
可以使用以下命令通过pip安装scikit-learn:
或者在虚拟环境中
常用模块
-
linear_model: 线性回归、逻辑回归等模型
-
tree: 决策树
-
ensemble: 集成方法,如随机森林、梯度提升
-
preprocessing: 数据预处理工具
-
model_selection: 模型选择与验证
示例:线性回归
from sklearn.linear_model import LinearRegression
import numpy as np

# 准备数据
X = np.array([[1], [2], [3], [4], [5]])
y = np.array([2, 4, 6, 8, 10])

# 创建模型
model = LinearRegression()

# 训练模型
model.fit(X, y)

# 进行预测
predictions = model.predict([[6]])
print(predictions)  # 输出: [12.]
数据集的交叉验证
当我们拿到一个数据集时,需要进行切分。
首先,将数据集分为训练集和测试集,训练集用于训练模型,测试集用于评估模型的性能。
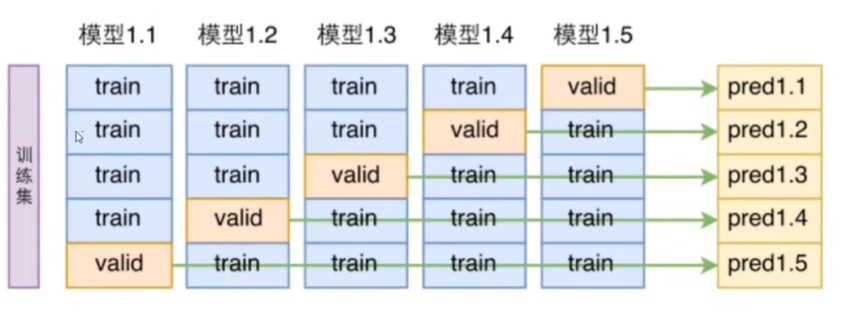
然而,在训练中,我们也常常需要对模型的性能进行评估,但是又不可能拿测试集来评估,因为这样会导致模型对测试集过拟合。因此,我们就需要在训练集内部进行切分,这就是交叉验证。
例如,我们可以将训练集分为5份,用1,2,3,4份训练模型,用第5份来评估模型的性能。然而,第5份数据可能比较复杂或者其他等等,不具有突出代表性,因此我们可以再用1,2,3,5份训练模型,用第4份来评估模型的性能,以此类推,我们可以得到5个模型,5个评估结果,最后取平均值。
因此,一个数据集的架构是:
-
训练集: 用于训练模型
-
验证集: 用于调整模型的超参数
-
测试集: 用于评估模型的性能
在sklearn中,就有交叉验证的库可以调用:
import numpy as np  # 导入numpy库用于数值计算
import os  # 导入os库用于操作系统相关功能
import matplotlib.pyplot as plt  # 导入matplotlib用于绘图
import warnings  # 导入warnings库用于控制警告信息
from sklearn.datasets import fetch_openml  # 从sklearn.datasets导入fetch_openml函数用于获取数据集
import joblib  # 导入joblib用于数据的持久化存储
from sklearn.model_selection import cross_val_score  # 导入cross_val_score用于交叉验证
from sklearn.linear_model import SGDClassifier  # 导入SGDClassifier用于分类模型

# 忽略所有警告信息
warnings.filterwarnings("ignore")

# 设置随机种子以确保结果可重复
np.random.seed(42)

# 定义数据集的保存路径
data_path = 'mnist_784.pkl'

# 检查本地是否存在数据集文件
if os.path.exists(data_path):
    mnist = joblib.load(data_path)  # 加载本地数据集
    print("加载本地数据集")
else:
    # 如果本地不存在,则从OpenML下载MNIST数据集
    mnist = fetch_openml('mnist_784', version=1, as_frame=False, parser='auto')
    joblib.dump(mnist, data_path)  # 保存下载的数据集到本地
    print("下载并保存数据集")

# 将特征数据转换为float64类型
X = mnist.data.astype('float64')
# 将目标标签转换为int32类型
y = mnist.target.astype('int32')

# 划分训练集和测试集,前60000个样本用于训练,后10000个样本用于测试
X_train, X_test = X[:60000], X[60000:]
y_train, y_test = y[:60000], y[60000:]

# 打印训练集和测试集的形状信息
print("数据集形状:")
print(f"X_train: {X_train.shape}, X_test: {X_test.shape}")
print(f"y_train: {y_train.shape}, y_test: {y_test.shape}")

# 生成一个0到60000的随机排列索引
shuffle_index = np.random.permutation(60000)

# 根据随机索引打乱训练集的顺序
X_train, y_train = X_train[shuffle_index], y_train[shuffle_index]

# 实例化SGD分类器,设置最大迭代次数、容忍度和随机状态
sgd_clf = SGDClassifier(max_iter=10000, tol=1e-3, random_state=42)

# 创建一个二元目标变量,仅标记为5的样本为True,其余为False
y_train_5 = (y_train == 5)

# 使用训练数据拟合SGD分类器
sgd_clf.fit(X_train, y_train_5)

# 打印交叉验证的准确率
print("交叉验证准确率:")

# 进行3折(把训练集拆分为3份)交叉验证,计算准确率
accuracy = cross_val_score(sgd_clf, X_train, y_train_5, cv=3, scoring='accuracy')

# 输出交叉验证的结果
print(accuracy)
命令行输出:
加载本地数据集
数据集形状:
X_train: (60000, 784), X_test: (10000, 784)
y_train: (60000,), y_test: (10000,)
交叉验证准确率:
[0.9681  0.95655 0.95515]
混淆矩阵
混淆矩阵一般用于评估分类模型的性能,它是一个二维矩阵,用于展示模型的预测结果和真实标签之间的关系。一般的结构为:
import numpy as np  # 导入numpy库用于数值计算
import os  # 导入os库用于操作系统相关功能
import matplotlib.pyplot as plt  # 导入matplotlib用于绘图
import warnings  # 导入warnings库用于控制警告信息
from sklearn.datasets import fetch_openml  # 从sklearn.datasets导入fetch_openml函数用于获取数据集
import joblib  # 导入joblib用于数据的持久化存储
from sklearn.model_selection import cross_val_score  # 导入cross_val_score用于交叉验证
from sklearn.linear_model import SGDClassifier  # 导入SGDClassifier用于分类模型

# 忽略所有警告信息
warnings.filterwarnings("ignore")

# 设置随机种子以确保结果可重复
np.random.seed(42)

# 定义数据集的保存路径
data_path = 'mnist_784.pkl'

# 检查本地是否存在数据集文件
if os.path.exists(data_path):
    mnist = joblib.load(data_path)  # 加载本地数据集
    print("加载本地数据集")
else:
    # 如果本地不存在,则从OpenML下载MNIST数据集
    mnist = fetch_openml('mnist_784', version=1, as_frame=False, parser='auto')
    joblib.dump(mnist, data_path)  # 保存下载的数据集到本地
    print("下载并保存数据集")

# 将特征数据转换为float64类型
X = mnist.data.astype('float64')
# 将目标标签转换为int32类型
y = mnist.target.astype('int32')

# 划分训练集和测试集,前60000个样本用于训练,后10000个样本用于测试
X_train, X_test = X[:60000], X[60000:]
y_train, y_test = y[:60000], y[60000:]

# 生成一个0到60000的随机排列索引
shuffle_index = np.random.permutation(60000)

# 根据随机索引打乱训练集的顺序
X_train, y_train = X_train[shuffle_index], y_train[shuffle_index]

# 实例化SGD分类器,设置最大迭代次数、容忍度和随机状态
sgd_clf = SGDClassifier(max_iter=10000, tol=1e-3, random_state=42)

# 创建一个二元目标变量,仅标记为5的样本为True,其余为False
y_train_5 = (y_train == 5)

from sklearn.model_selection import cross_val_predict  # 导入cross_val_predict用于交叉验证预测

result = cross_val_predict(sgd_clf, X_train, y_train_5, cv=3)

from sklearn.metrics import confusion_matrix  # 导入confusion_matrix用于混淆矩阵计算

matrix = confusion_matrix(y_train_5, result)

print(f"混淆矩阵:\n{matrix}")
输出结果:
53124代表非5的结果被成功识别,1455代表非5的结果被错误识别,949代表5的结果被错误识别,4472代表5的结果被成功识别。Sklearn中的评估函数
- accuracy_score: 计算准确率.
- precision_score: 计算精确率.
- recall_score: 计算召回率.
- f1_score: 计算F1分数(精确率和召回率的调和平均值).
评估阈值
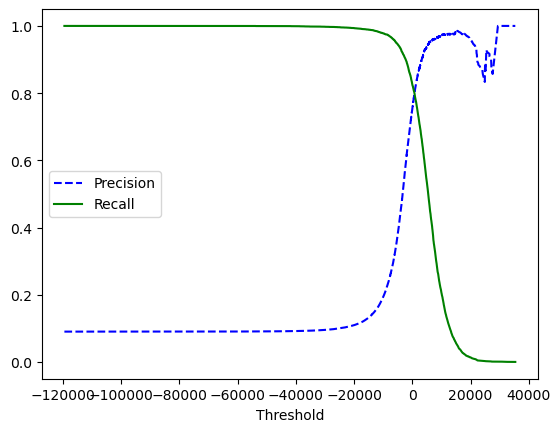
阈值指的是分类器的决策边界,当分类器的预测概率大于阈值时,样本被划分为正例,否则被划分为负例。在sklearn中,我们可以使用decision_function()方法获取分类器的决策分数。这个函数返回每个样本的分数,然后我们可以根据这个分数设置不同的阈值。
from sklearn.metrics import precision_recall_curve  # 导入precision_recall_curve用于计算精确率和召回率

# 获取分类器的决策分数

scores = cross_val_predict(sgd_clf, X_train, y_train_5, cv=3, method='decision_function')

# 计算精确率和召回率

precisions, recalls, thresholds = precision_recall_curve(y_train_5, scores)

# 绘制精确率和召回率曲线

plt.plot(thresholds, precisions[:-1], 'b--', label='Precision')

plt.plot(thresholds, recalls[:-1], 'g-', label='Recall')

plt.xlabel('Threshold')

plt.legend()

plt.show()
阈值越大,精确率越高,召回率越低,反之亦然。
ROC曲线
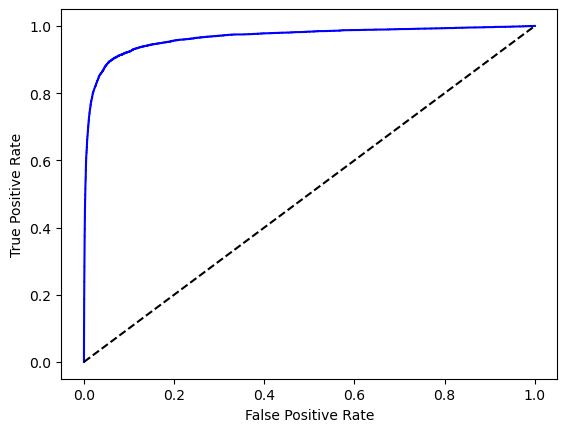
ROC曲线也是一种用于评估二元分类器(就像这里识别某个数字是不是5)性能的工具,它展示了真正例率(TPR)和假正例率(FPR)之间的关系。TPR是指正确识别正例的比例,FPR是指错误识别负例的比例。ROC曲线的横轴是FPR,纵轴是TPR。
from sklearn.metrics import roc_curve  # 导入roc_curve用于计算ROC曲线

# 计算ROC曲线

fpr, tpr, thresholds = roc_curve(y_train_5, scores)

# 绘制ROC曲线

plt.plot(fpr, tpr, 'b-')

plt.plot([0, 1], [0, 1], 'k--')

plt.xlabel('False Positive Rate')

plt.ylabel('True Positive Rate')

plt.show()
这里理想的状态是ROC曲线尽可能地靠近左上角,即FPR为0,TPR为1。
常用的评估方法是计算ROC曲线下的面积(AUC),AUC越接近1,分类器的性能越好。AUC为0.5意味着和纯随机分类没什么区别。
from sklearn.metrics import roc_auc_score  # 导入roc_auc_score用于计算AUC

# 计算AUC

auc = roc_auc_score(y_train_5, scores)

print(f"AUC: {auc}")
正则化
正则化是一种用于防止过拟合的技巧,它通过在损失函数中添加一个正则项来限制模型的复杂度。
记:
举个例子,假设现在的X值为\([1,1,1,1]\),有两组\(\theta\)值,一组为\([4,0,0.0]\),另一组为\([1,1,1,1]\),很显然,它们的\(Y_{\text{prediction}}\)是一样的,因此MSE必然是一样的,但是正则化项是不一样的,第一组的正则化项为\(4^2=16\),第二组的正则化项为\(1^2+1^2+1^2+1^2=4\),因此第一组的正则化项更大,因此第一组的\(J(\theta)\)值更大,也就是loss更大.正则化的意义在于让模型尽可能使用多的特征,但是不让特征的权重过大,让模型更加平滑。
上述的公式是L2正则化,也叫岭回归,还有L1正则化,也叫Lasso回归,L1正则化的公式如下:
L1和L2的区别
| 特点 | L1 正则化 | L2 正则化 |
|---|---|---|
| 权重特征 | 会使部分特征权重变为 0 | 只会使权重变小,不会变为 0 |
| 主要用途 | 特征选择 | 防止过拟合 |
| 数学表达 | \(\alpha \sum_{i=1}^{n} \|\theta_i\|\) | \(\frac{\alpha}{2} \sum_{i=1}^{n} \theta_i^2\) |
-
L1 正则化:
- 要么用,要么不用
- 某些特征的权重会直接变成 0
- 选择最重要的特征保留
-
L2 正则化:
- 都用,但都不要用太狠
- 所有特征的权重都会变小,但不会变成 0
- 更适合防止模型过度依赖某些特征
上面的公式中也有一个超参数\(\alpha\),这个超参数的作用是控制正则化项的权重,\(\alpha\)越大,正则化项的权重越大,模型的复杂度越低,反之亦然。
